Under the column CRM Information (Customer Relationship Management), Ingenious.V12 quotations you highlights on the most important business figures, such as sales turnover and profit margin. With one glance, you can see the current goods on order, open quotations, or whether the customer has not paid outstanding invoices yet. The period of the analysis can be freely selected.
CRM information of a sample contact
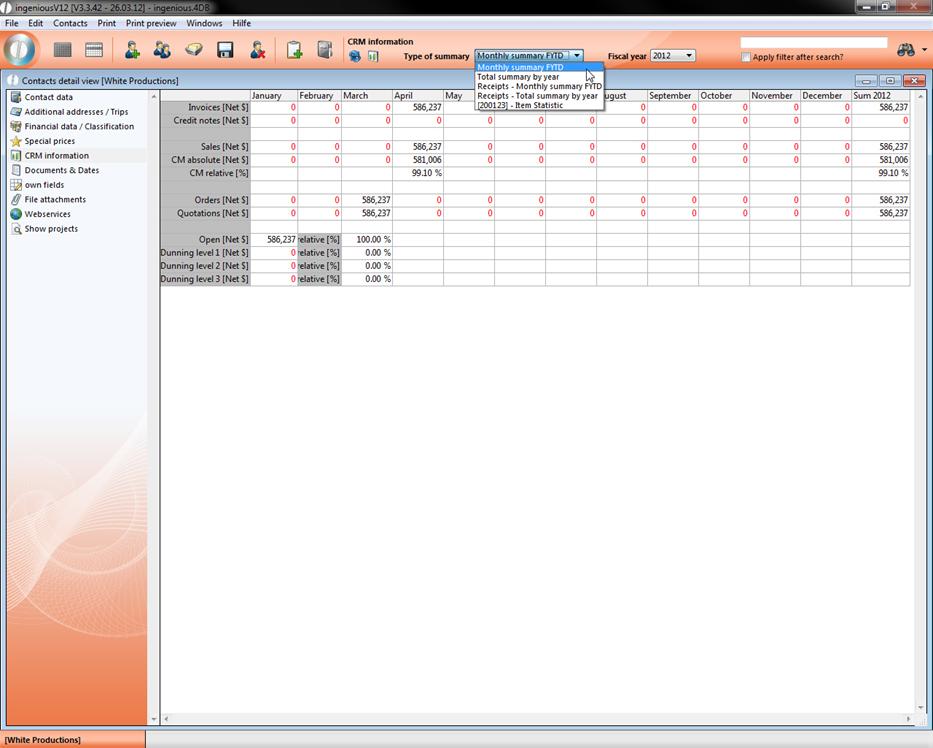
You have the possibility to display the business figures with color. You can specify the type of evaluation and the fiscal year. In addition, customized article statistics can be retrieved with the analysis type.
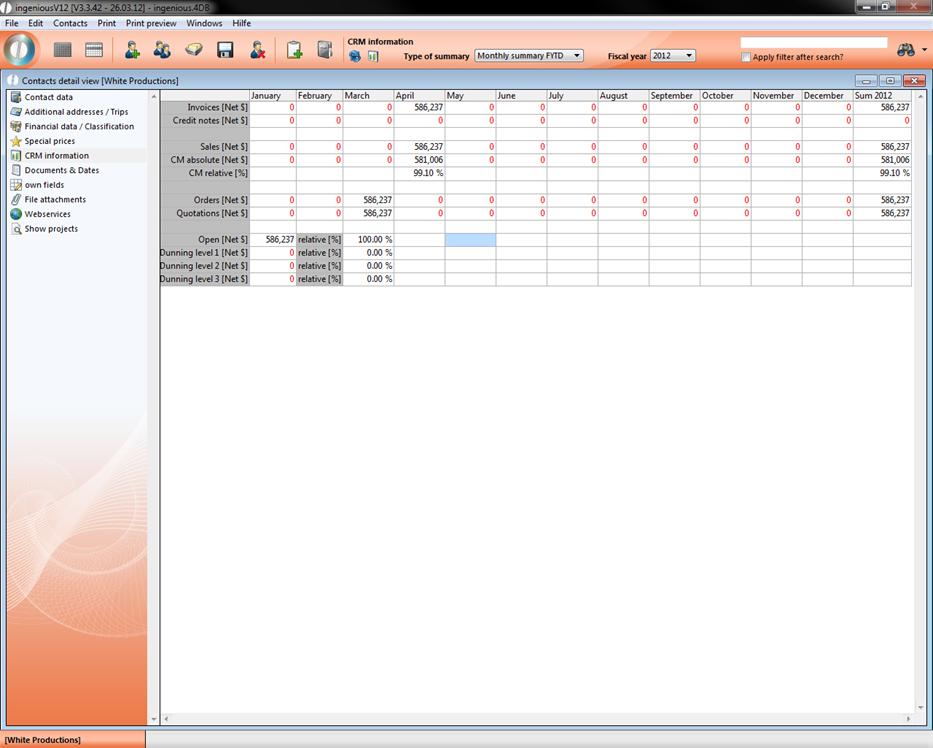
With the ![]() Button “Changes (tabular/graphic analysis)”, you will arrive at the different diagrams that also differ after the type of analysis. In the following illustrations, the annual analysis of a sample customer is represented. You of course also have the possibility to leave the diagrams as a monthly statement for one fiscal year. You can also switch again to the tabular view mode and set the “Monthly analysis FY” in the type analysis.
Button “Changes (tabular/graphic analysis)”, you will arrive at the different diagrams that also differ after the type of analysis. In the following illustrations, the annual analysis of a sample customer is represented. You of course also have the possibility to leave the diagrams as a monthly statement for one fiscal year. You can also switch again to the tabular view mode and set the “Monthly analysis FY” in the type analysis.
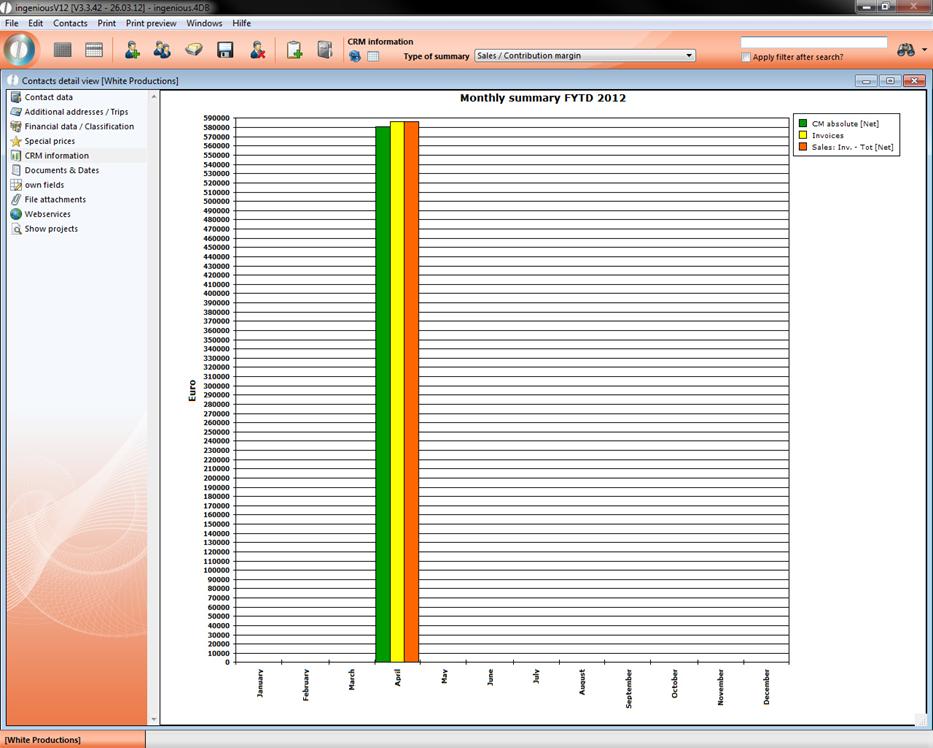
The first graphic evaluation form is a bar diagram for the display of sales and profit margin. For a larger overview, the bars are differentiated by colors. Invoices are yellow, the net sales are red and the absolute profit margin is displayed in green . The X-axis shows you the fiscal year and the Y-axis shows you the amount.
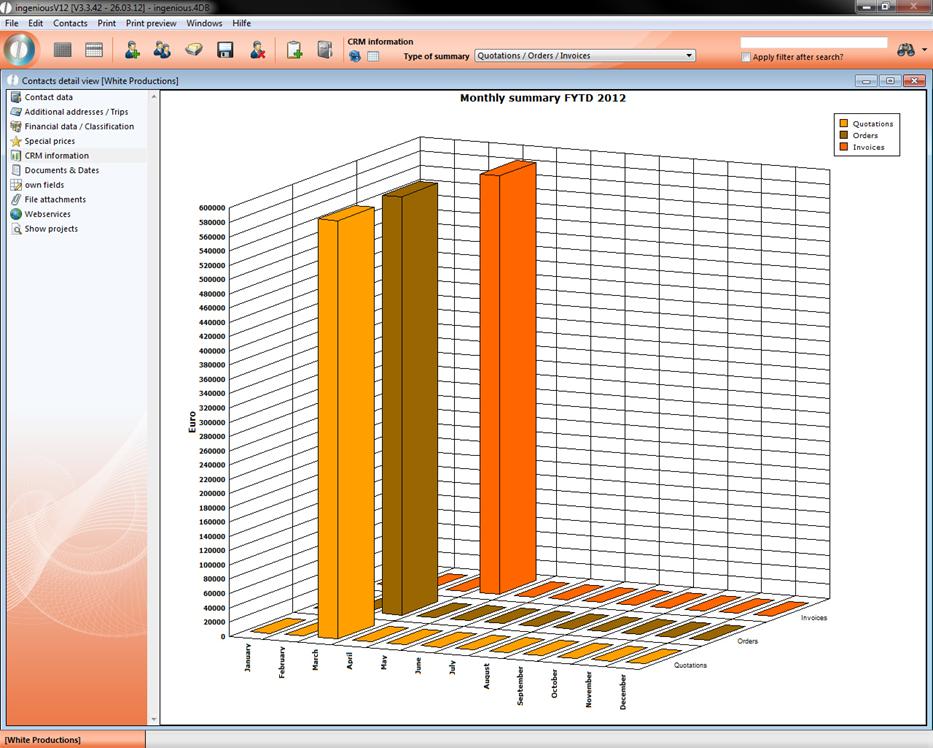
The next diagram displays the quotations, contracts and invoices in a three-dimensional format. For a better overview, the bars are represented in different colors.
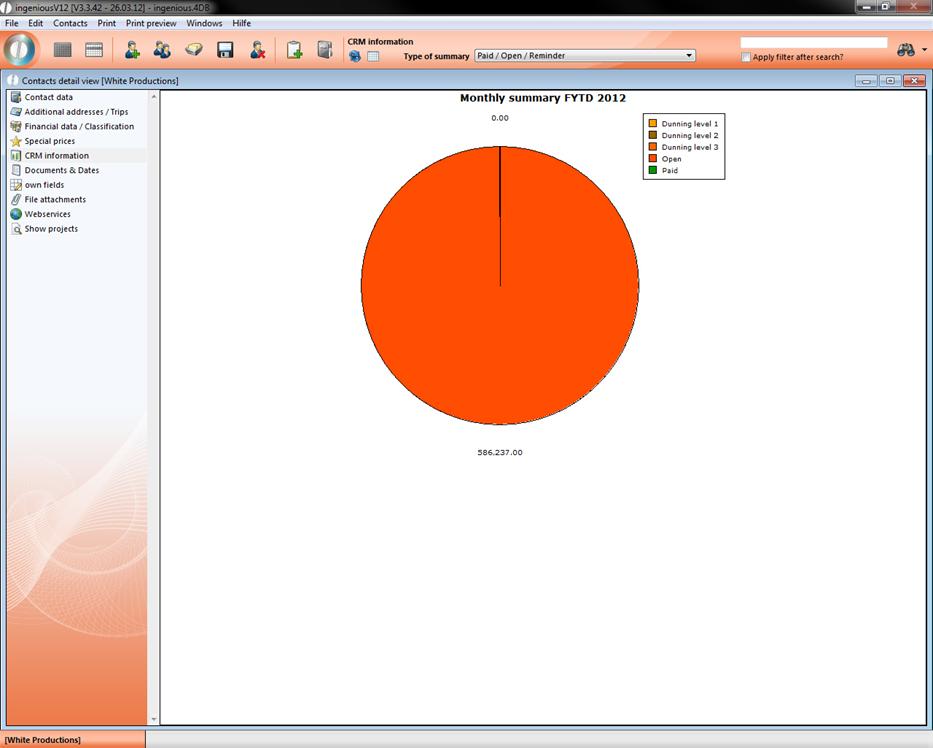
The third graphic representation shows a circle diagram in which different levels of the debt collection or invoice status of a customer is indicated in color.